Experiments with sound files in Haskell
06 June 2020
This is a bit of a learning project about how to determine the pitch of sound from a given sound file. The primary goal of this project is to determine the notes being played in wav file and map it to it’s musical note.
This is a rough overview of some code I had written a few years ago using Haskell in this repository. In this project there examples of
- MIDI manipulation,
- FFT using FFTW,
- A custom heatmap chart was created for Charts to view the spectrogram.
The code is rough and isn’t particularely performant, but it works.
Finding the note
The most basic sound possible is a basic since wave. Musically, 440 Hz (middle A) as it is the note most used for tuning instruments. The first test is
- Given a sine wave at 440 Hz, the output should be the note A4
The first attempt is perform a Fourier transform of the whole signal, and find the frequency peaks. The number of samples in one wave at 440Hz is
\[\frac{\text{samples per second}}{440 \text{ Hz}} = \frac{44100 \text{ s}^{-1}}{440 \text{ Hz}} = 100.2 \text { samples}\]So plotting the first ~200 samples gives us an idea of what the signal looks like:

To make things easier to interpret we will convert the x-axis to seconds:
\[t = \frac{440 \text{ Hz}}{N} \cdot x\]where \(N\) is the number of samples, \(x\) is the frame number, \(t\) is the time in seconds.
Next we perform a DTFT across the whole signal to find the dominant frequencies of the signal which shows the expected 440 Hz:

The sample we are starting with is just a single sine wave, but the following code works if we have multiple notes. Pretending that the signal changes over time, we will perform a \(\text{STFT}\) on the signal which will produce a list of tuples \((\text{start time}, \text{note})\). The code in the source lives in the function sftfSection which I will omit here since it’s a bit of a mess, but the inputs are:
- A window function to apply to the signal (Hann Window in this case).
- A window width (remembering the Nyquist Frequency).
- The signal.
To filter out noise of low quality signals, for each windowed STFT the frequencies are filtered to find the maxima per window.
Most of the code to perform the STFT looks like this:
-- samples = N = number of samples
-- n = sample number
hannWindow :: Integer -> Integer -> Double
hannWindow samples n =
  0.5 * (1 - cos (2 * pi * fromIntegral n / (fromIntegral samples - 1)))

-- | Apply window function to the set of samples
windowedSection
  :: CArray Int Double -> Int -> Integer -> Integer -> CArray Int Double
windowedSection data_ totalSamples n stepWidth = ixmapWithIndP
  (0, totalSamples)
  id
  (\_ x i' -> if i' < fromIntegral n || i' >= fromIntegral (n + stepWidth)
    then 0
    else x * hannWindow (fromIntegral stepWidth) (fromIntegral i' - n)
  )
  data_

-- | n = start of step sample number
stftSection
  :: CArray Int Double -> Int -> Integer -> Integer -> (Step, [Complex Double])
stftSection !completeSample totalSamples stepWidth n =
  (fromIntegral n, VS.toList $ VS.unsafeFromForeignPtr fftptr 0 len)
 where
  fft = dftRC (windowedSection completeSample totalSamples n stepWidth)
  (len, fftptr) = toForeignPtr fft
Here are the resulting spectrograms (using custom code for Charts):
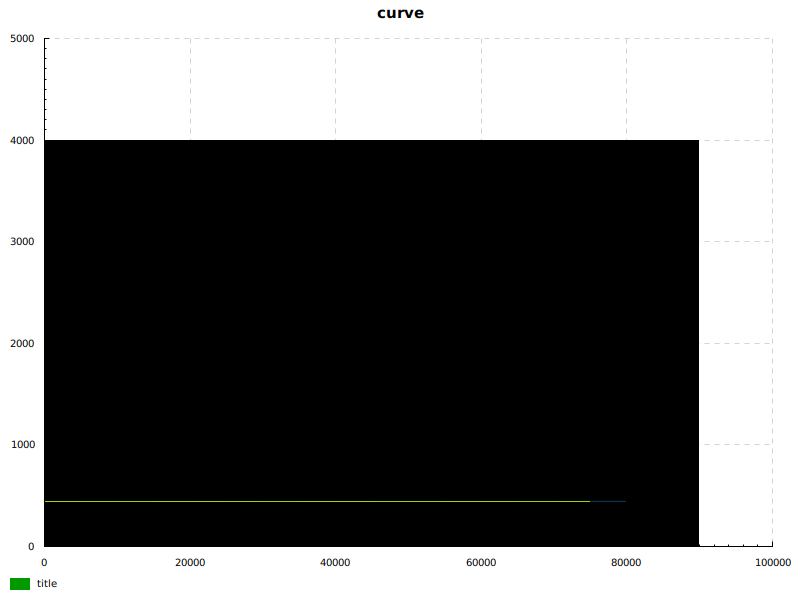
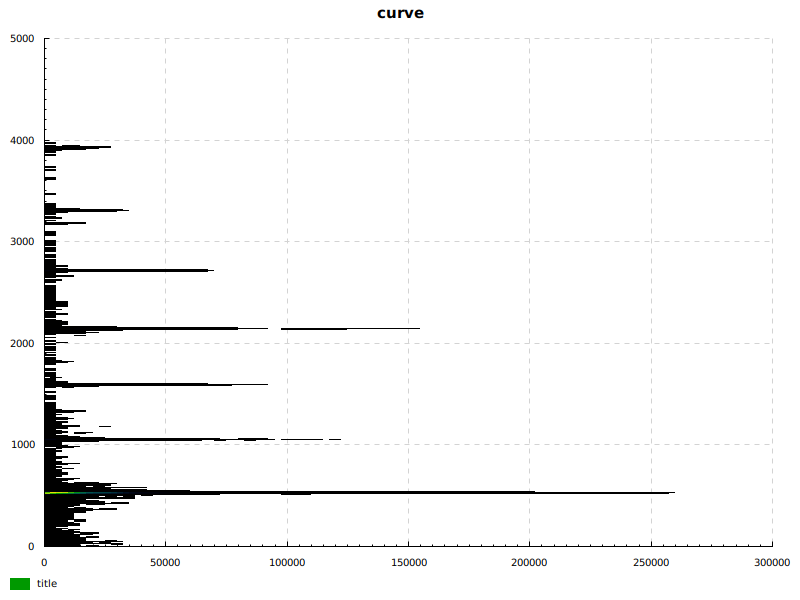
As we can see the pure sine wave produces a really clear signal at 440Hz but the piano sample has other signals at higher frequencies, particularely overtones which occur at multiples of 440Hz.
Midi library example
Now that we have the frequencies of the signal, we can generate a Midi file with the midi package.
Before using the Midi package, we need to learn how to use it. Here’s a quick example that plays two notes within 100 frames after each other:
import qualified Sound.MIDI.File as MF
import qualified Sound.MIDI.File.Save as MS
import qualified Sound.MIDI.File.Event as ME
import qualified Sound.MIDI.Message.Channel as MC
import qualified Data.EventList.Relative.TimeBody as E

MF.Cons
    Serial
    (Ticks 60)
    [ E.cons 100 (ME.MIDIEvent (MC.Cons (MC.toChannel 1) (MC.Voice (MCV.NoteOn  (MC.toPitch 60) (MC.toVelocity 60)))))
    ( E.cons 100 (ME.MIDIEvent (MC.Cons (MC.toChannel 1) (MC.Voice (MCV.NoteOn  (MC.toPitch 80) (MC.toVelocity 60)))))
    ( E.cons 100 (ME.MIDIEvent (MC.Cons (MC.toChannel 1) (MC.Voice (MCV.NoteOff (MC.toPitch 60) (MC.toVelocity 60)))))
    ( E.cons 100 (ME.MIDIEvent (MC.Cons (MC.toChannel 1) (MC.Voice (MCV.NoteOff (MC.toPitch 80) (MC.toVelocity 60)))))
    ( E.empty ))))
    ]
Converting notes to MIDI
To produce a MIDI, we transform this into a list of MIDIEvents at time t, then concatenate that list to producing a single MIDIEvent:
import qualified Data.EventList.Relative.TimeBody as E

type Octave = Int
type Frequency = Double

-- This would come from the results of the STFT
notes = [Note A 1, Note A 2]

data NoteLetter = A
        | Ais
        | B
        | C
        | Cis
        | D
        | Dis
        | E
        | F
        | Fis
        | G
        | Gis
        deriving (Show, Eq)

data Note = Note NoteLetter Octave deriving (Show, Eq)

-- | Retreives the lowest frequency of a note.
getBaseFreq :: NoteLetter -> Frequency
getBaseFreq A   = 27.50
getBaseFreq Ais = 29.14
getBaseFreq B   = 30.87
getBaseFreq C   = 16.35
getBaseFreq Cis = 17.32
getBaseFreq D   = 18.35
getBaseFreq Dis = 19.45
getBaseFreq E   = 20.60
getBaseFreq F   = 21.83
getBaseFreq Fis = 23.12
getBaseFreq G   = 24.50
getBaseFreq Gis = 25.96

-- | Convert a Note to it's MIDI note value.
midiPitch :: Note -> Int
midiPitch (Note letter n) =
  round $ 12 * logBase 2 (((2 ^ n) * getBaseFreq letter) / 440) + 69

-- Contruct a list of midi events without time information.
let sections = map
    (foldl
        (\acc (step, note) ->
            E.append acc (E.singleton (toElapsedTime 0) (ME.MIDIEvent (MC.Cons (MC.toChannel 1) (MC.Voice (MCV.NoteOn (MC.toPitch (midiPitch note)) (MC.toVelocity 20)))))))
        E.empty)
    notes

-- Build final tracks. We haven't attempted to parse the time at which the signal happened to assume it happens after 100 frames
let tracks = E.append
    (foldl (\acc section -> E.append acc (E.delay 100 section)) E.empty sections) $
    E.singleton (toElapsedTime 100) (ME.MIDIEvent (MC.Cons (MC.toChannel 1) (MC.Mode MCM.AllNotesOff)))

let midi = Cons Serial (Ticks 120) [tracks] :: T
MS.toFile ("music.midi") midi
Learnings
This general flow works easily enough for very simple audio, but once polyphony or even regular instruments get introduced the results become very messy due to the wide range of signal produced. Adjusting the window length has some noticible changes to the spectrograms, and highlighted that there isn’t a universal window length that works for most cases.
I don’t feel like Haskell provided much value in writing this. The ability to create types denoting note values was quite useful, but the transformations between the many different datatypes to go from the FFT double to a MIDI double was more trouble than it was worth and produces fairly noisey code. Using something out of the box be easier, but not as much of a learning experience.